Hotstats is a replay analysis platform I built with a colleague for our joint master thesis. It focuses on finding meaningful visualizations for team‑based performance in Heroes of the Storm.
Goal
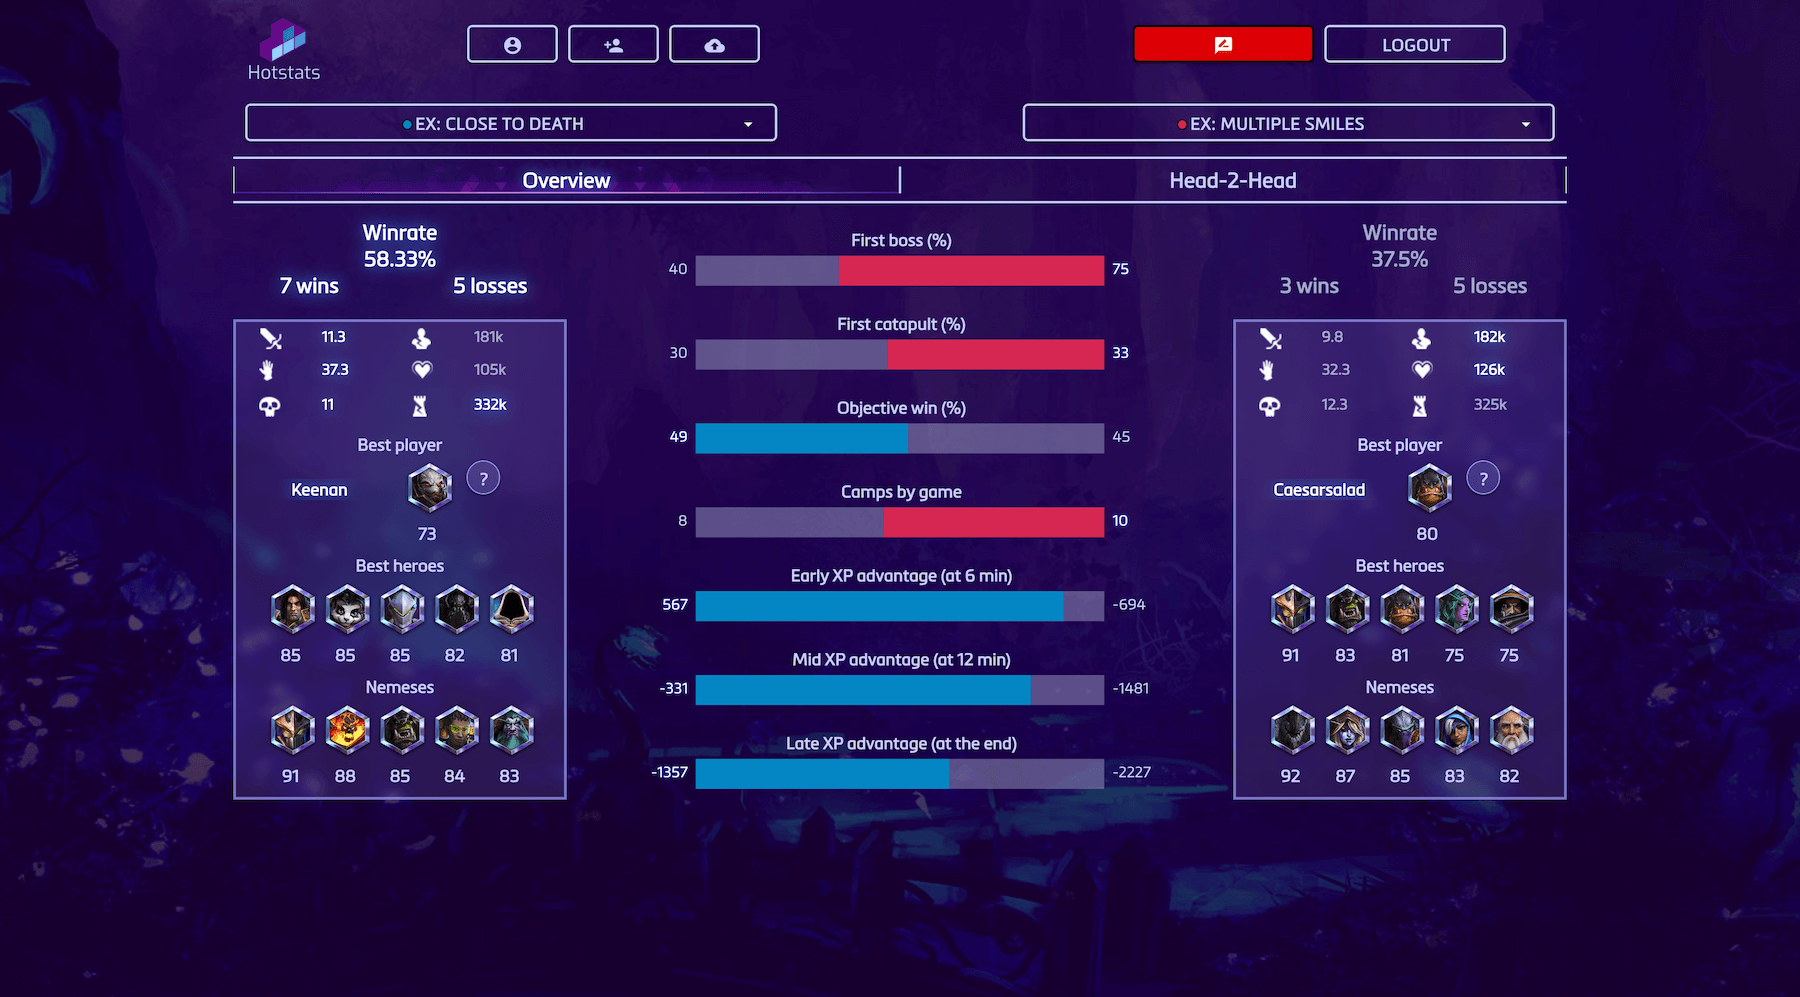
Help players, teams, and analysts understand not just who won, but why: pivotal moments, strategic choices, efficiency gaps, and comparative strengths between both teams.
What Users Can Do
- Upload match replays (Heroes of the Storm
.StormReplayfiles) - Automatically parse and index gameplay events
- Compare overall performance between the two teams (XP, objectives, talent timing, map control)
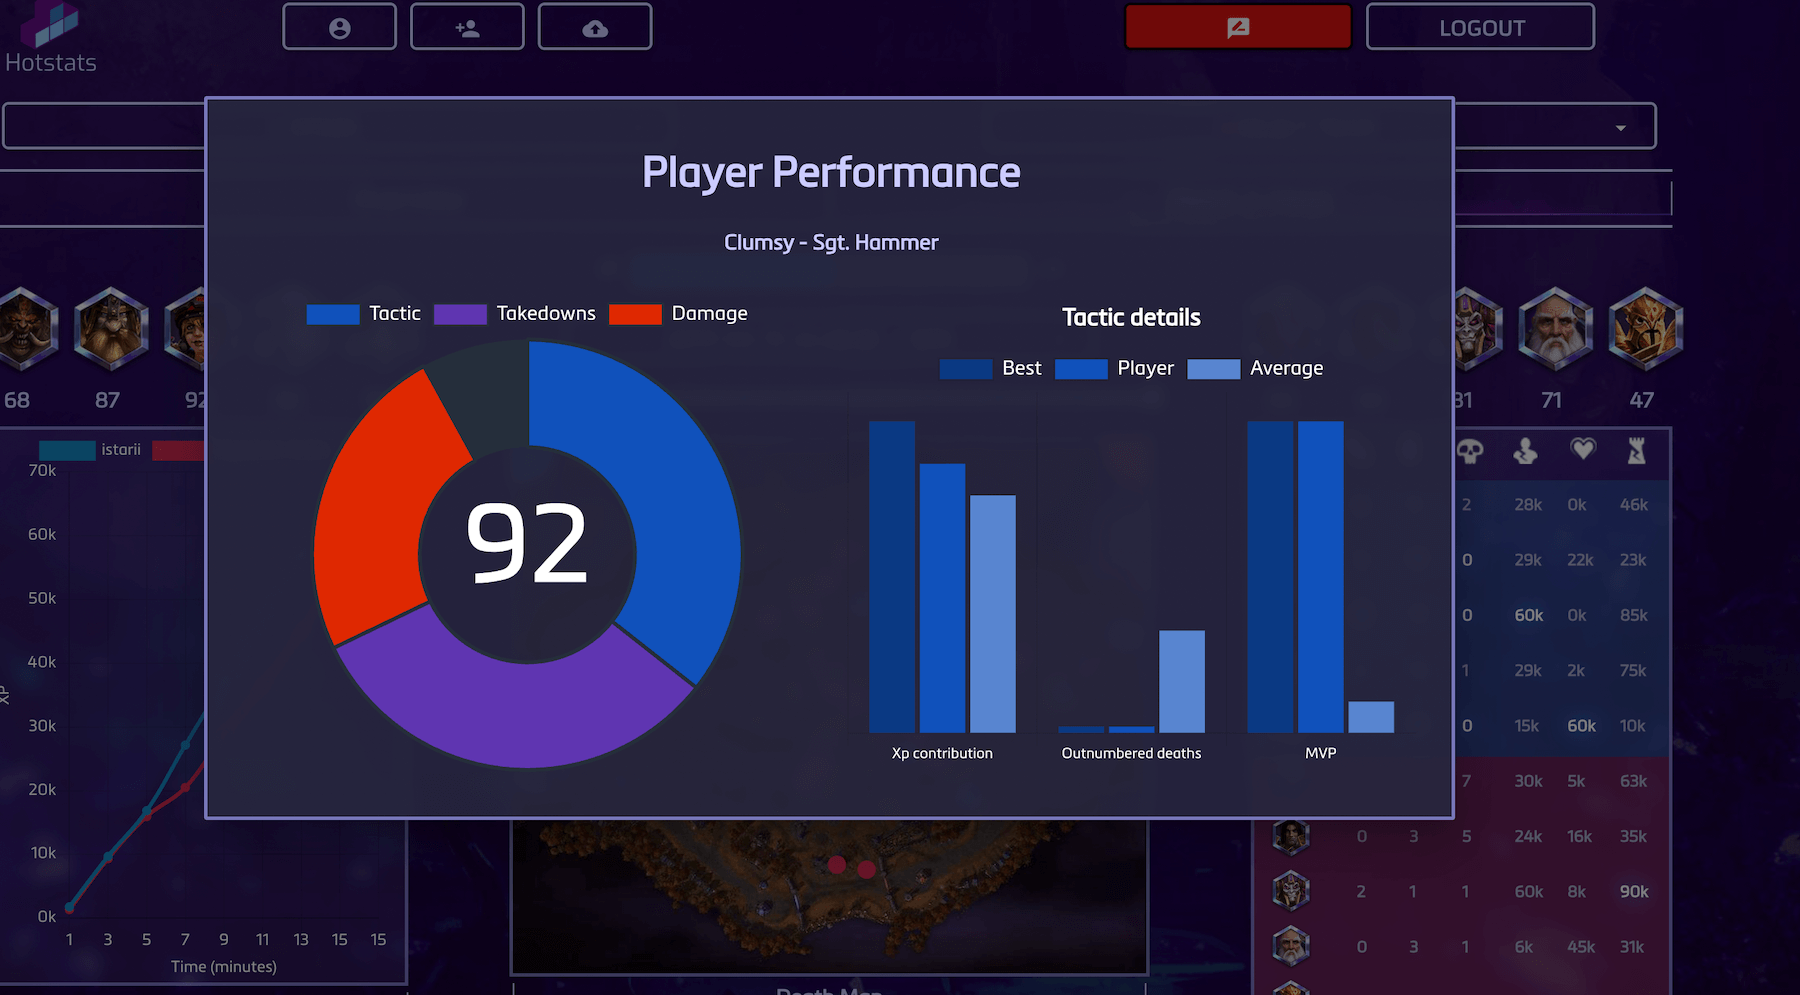
- Drill down per player (damage, healing, soak efficiency, deaths, rotations)
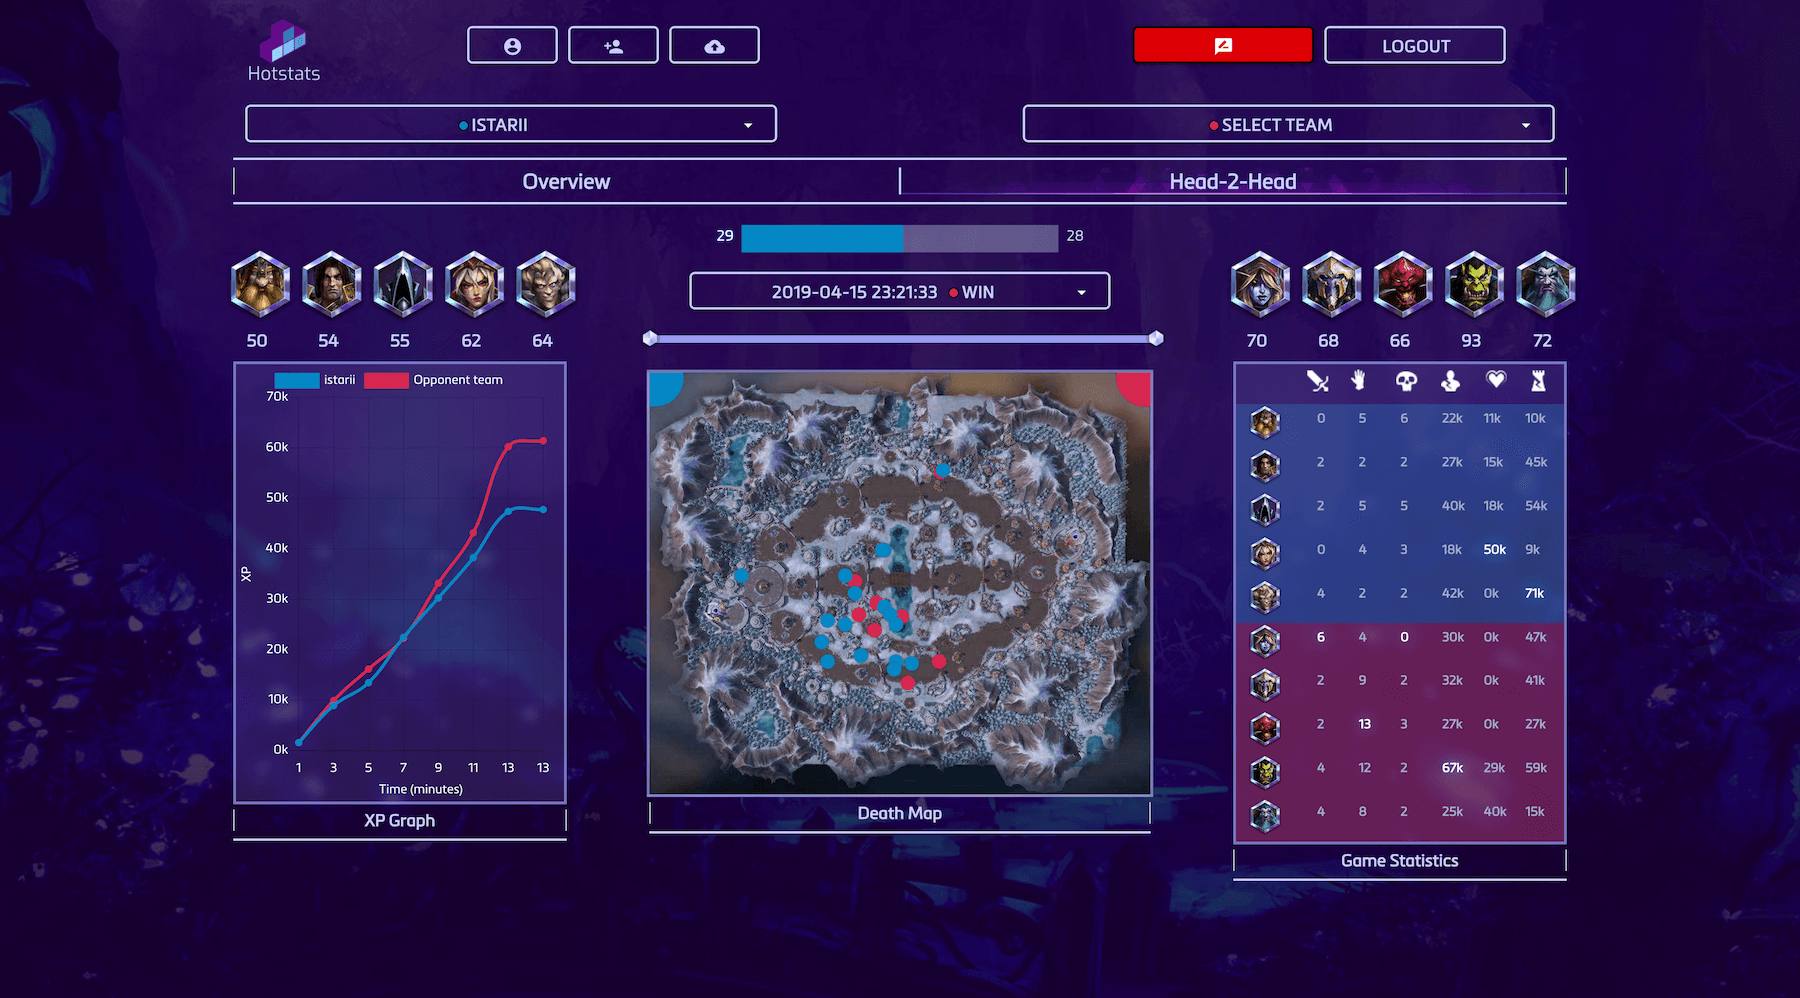
- Highlight defining moments (objective captures, boss takes, talent spikes, team fights)
Architecture Overview
| Layer | Tech | Purpose |
|---|---|---|
| Frontend | React | User interface, charts, upload flow |
| Hosting/Auth/DB | Firebase (Firestore + Auth) | Serverless delivery, user accounts, replay metadata, caching |
| Cloud Functions | Firebase Functions | Orchestrating replay ingestion & queueing parse jobs |
| Parsing Service | Flask (Python) | Exposes an API endpoint for replay parse requests |
| Replay Parsing | C# via python.NET | Uses existing C#/library ecosystem to decode .StormReplay then bridges into Python for post‑processing |
Why This Stack?
- React: rapid component iteration for complex visualization layouts.
- Firebase: zero‑ops hosting plus simple auth and realtime updates.
- Flask: lightweight API surface dedicated to parse tasks.
- C# + python.NET: leverage mature Heroes of the Storm replay parsing libraries written for .NET while keeping analytics pipelines in Python.
Parsing Flow
- User uploads replay → stored + metadata entry created.
- Firebase Function triggers a parse job.
- Flask endpoint receives the job, invokes C# parser through python.NET.
- Raw events transformed into structured JSON (timeline, team stats, player stats).
- Results pushed back to Firestore and flagged as ready.
- Frontend subscribes → visualizations update (charts, tables, “moments” timeline).
Visualizations & Metrics
- Team timeline: experience lead shifts & objective captures.
- Talent timing: comparison of spike advantages (e.g., Level 10 heroic sync).
- Player performance cards: damage/healing/damage taken, death timings, soak efficiency.
- Fight breakdowns: aggregated stats per major team fight cluster.
- Momentum indicators: sequences of events that correlate with win probability increases.
Challenges
- Replay format quirks: version changes required resilience in the parser.
- Synchronizing heterogeneous data (talents, objectives, map events) into a unified timeline.
- Ensuring performance for batch uploads without exhausting function quotas.
- Keeping visualizations readable (avoiding clutter on long matches).
Outcomes & Learnings
- Provided players clearer post‑match narratives beyond the final score.
- Showed that lightweight serverless + a specialized parsing microservice can coexist cleanly.
- Gave us hands‑on experience with cross‑language integration (C# ↔ Python) and event data modeling.
Try It / Source
Explore: https://hotstats.be/#overview
—
First big analytics project combining gameplay domain knowledge with data engineering — and plenty of lessons in designing timelines & visual performance indicators. Thanks to my partner in crime Thibault Hermans for the collaboration!